More stuff on email!

 Hey All,  For regular readers who are yet to subscribe to my mail distribution list, please do so. Additional content:  Daily morning comme...

Wednesday, 31 July 2019

Yesterday's perfect oil trade.

Hi everyone.

Just a quick update today to show you what happened in my best trade of yesterday regarding WTI.

Below is the trade in full detail. In the early hours of the session, we had this push above the trendline on the back of low volume. Naturally, this was not enough in itself to constitute a push higher dramatically. The trendline ont he top was however very well respected.

We also had the bottom trendline forming part of a triangle formation which indicated we were due for a breakout (as we were between 2/3 and 3/4 of the way betewen the base of the triangle and the vertex). Ultimately, we then came back down to test the trendline where the blue box is, and this was my perfect buy signal indicated by the up arrow.

I must confess that if the API weekly crude draw released yesterday at 21:30 GMT would have been a worse (by which I mean, less negative) number, then the market would probably have dropped rather than rallied to the extent which it did.

Anyhow, that just illustrates the point that we cannot afford to ignore fundamentals.


This was a very cheeky trade which netted me an even cheekier $1.45 profit per barrel.

Monday, 29 July 2019

More pound analysis on the back of today's trading.

Well I was not expecting the move down which we have seen thus far today in the pound. However, on the back of the heightened no-deal preparations and the seeming willingness of the Johnson cabinet to enact a no-deal, it is perhaps not necessarily surprising.

Here's my chart of the day:

[Note: The trendline has nothing to do with the day's price action - I forgot to delete it before the screenshot. In fact, that was my trendline which I drew before the beginning of the day's plunges. My initial reaction was that the trendline was too steep and could not continue. Much to the contrary, it steepened further!]

From a technical point of view, today has been absolutely beautiful. You can see I have the pivot points marked up on the chart and in the chart below I have zoomed in further to the 5 minute chart.


I have used the blue squares to show the areas of resistance and support acting perfectly around the S1/S2/S3. 

You can see that the day started slowly, and then we plunged below the S1, retested, then bounced down. We then bounced off the S2, and then plunged below it, retested the now resistance at the S2, and then plunged downwards. The most perfect opportunity was the final blue box where we bounced on that S3. 

Unfortunately, I have been away from the trading desk today, and haven't been able to take advantage of any of these support and resistance tests. 

Typical. 

Saturday, 27 July 2019

GBPUSD Analysis

Right we have a new PM here in the UK and I thought it would be a good idea just to do a little technical analysis on the pound. 

In terms of general trend lines and points of support, we are starting to enter territory which we haven't seen since 2017. Whilst the markets have a long memory, I am not entirely certain about how much confidence we can have in previous support levels. 


You don't have to be a chartist to see that the pound is moving down. However, I am interested in the four hour time frame triangle which is forming and holding well. 

Given that there will not be much news related to GBPUSD and Brexit while Parliament is in recess, it is worth noting that further aggressive pushes to the downside, in my opinion, remain unlikely. For now. 

However, we must also remember that in the week ahead we have the BOE rate decision and if they decide to cut (which is highly unlikely - according to Bloomberg, out of 24 analysts only one anticipates a cut, and we have to bear in mind previous hawkish comments from Carney) we will probably see significant pushes downwards towards the 1.23 handle. 


We also have to consider the Fed on Wednesday and the anticipated cut could cause a brief push up towards 1.245 on the back of algorithmic selling of the dollar on the news. However, I fully anticipate the dollar to return to its current level of strength as this rate cut is entirely expected. 

On the other hand, if the Fed holds, the dollar will appreciate markedly against all other currencies, oil will fall, gold will fall, stocks will fall etc. 


Again, in this unlikely case, the £ will probably fall to the 1.23 handle. 


Looking more longer-term on the pound, I am quite bullish. I do not believe we will (or that it is possible to) leave the European Union without a deal when we share a land border with the EU. Ultimately, this means we either get a deal in which case (dependent on deal) the pound could push to $1.40 or maybe even higher. Alternatively, we have a second referendum and then a remain win would push the pound higher still. 

However, the outlook worsens dramatically if we have a people's vote and then No Deal wins - this would be catastrophic and the pound would collapse. Again, I see this as being highly unlikely. 


Ultimately, my medium-term forecast (over August and September) is that the pound will appreciate a little on the back of the low news coverage - my forecast remain 1.27 ish. 

However, as the negotiations heat up in September and October, I can expect the pound to fall again to its current levels until the next inevitable Brexit delay. 


Slightly shorter term view on oil

So this is my main trade for the week and I'm relatively confident in what I've drawn and it seems like a potentially likely scenario.


The image outlines some potential opportunities to get long and short in the market.


The dotted lines show the resistance and supports which could act to bring this trade to life. If we break the top line, then expect a push higher to the top trendline again - or at least to the previous high. 

Happy Trading!


Update: 
Should probably have mentioned the trendline which is in the narrowest range to the downside is only a potential trend line and not a confirmed trend - there have only been two touches at the moment. 


Where now for oil?

I thought we'd take a brief look at the oil market today just to consider the potential direction for the medium-longer term. It remains my belief that oil is heading higher because demand concerns have been overstated. 

The Demand Side: 

Now, don't get me wrong, in the event of a worldwide economic downturn, then, of course, oil prices will be coming down due to the fall in demand. However, we have to consider the possibility that this is just a temporary slowdown - the Fed is likely to be getting ahead of the US weakness on Wednesday when it is expected to cut rates by 25 basis points. Furthermore, the ECB is changing the structure of interest rates through the use of tiering. Finally, China is pumping a large quantity of stimulus into the economy which has helped to stave off a wider economic downturn. 

So, for now, let's assume that the Federal Reserve is capable of engineering a "soft-landing". relates to Only a Half-Point Rate Cut From the Fed Will Do

Source: https://www.reviewecon.com/money-market2/money-market-increase-supply1
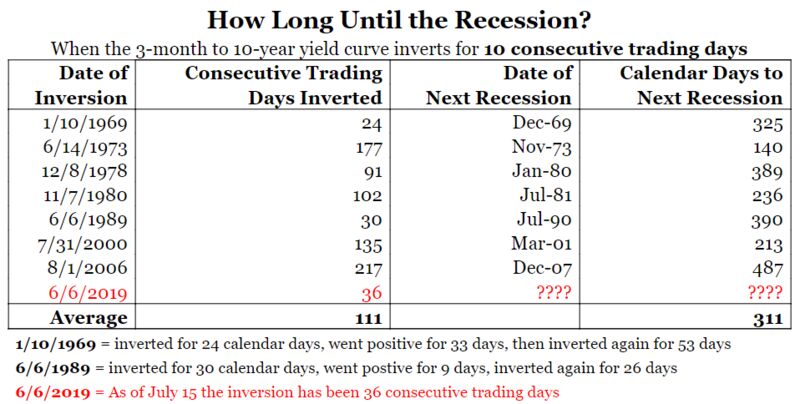
I know that many people believe the inversion of the yield curve is a recessionary indicator and has been very effective at predicting recessions historically. However, we must remember that the expansion following the financial crisis has not been "normal". Massive monetary stimulus has been pumped into the economy all around the world, and a basic understanding of the law of supply when we look at the money market can show that interest rates will be lower. 


So, personally, I am not entirely convinced that this inversion of the yield curve will, in fact, lead to a recession since we are in uncharted waters. 


Thus, I believe the expansion can continue for now. And thus, the demand concern is overstated. 


So that covers the demand side for oil.


The Supply Side: 

Over the last couple of weeks, we have been bombarded with headlines regarding Iran and its aggressions towards the Western World. Yet, we have not really noticed these events being priced into the market fully. 

Below is a chart of the oil market and I have marked on the upswings which have occurred from data recently. What we see is that every upswing is marked by a move back to the downside. Yes, oil did end the week up over the previous trading week, but only marginally, and the swings to the downside always seemed far more aggressive than the gentle grinds upwards. 


I have to say the big drop caught me quite by surprise and I was stung pretty heavily for a fairly large amount of money. But what has interested me about crude this week is the fact that we basically started and finished in exactly the same place, despite some major changes with regards to potential future supply. 

Thus, this adds to my case that I believe the market is overpricing the downside risk. 


Technically on the longer term....


I have to say that I literally just tried drawing these two trend lines on the weekly chart and it does look like there is something potentially in this trade with the narrowing range. Obviously, this could continue for several more weeks before we see a breakout either side, but it did strike me as interesting and a potential indicator that a major oil swing could be about to happen. Obviously though, we continue to be driven by fundamentals in this market. 


So there we are, that's my two cents on the oil market and I hope people have found this analysis somewhat useful. Let me know if you have any ideas regarding oil, but my thesis for the month remains that we continue to trade in a similar range between $54 and $58 a barrel. With a longer term upside potential, dependent upon the outcome of the Fed's exercise in giving the market what it wants despite the economic data being bullish.... 

I mean engineering a soft landing!


Friday, 19 July 2019

New GBPUSD Trade Longer Term

Hi everyone,

Thought I'd share a GBPUSD Long Trade which I have just discovered which has some significant potential to materialise over the next couple of days.

Due to the developments in preventing the proroguing of Parliament, the pound should see a relief bounce. I am hoping this takes us back to $1.27 ish.

The position is quite small worth 2500 and the stop loss is 50 points away - although if I detect the trend line break earlier, I could act more quickly to stop losses. The TP is further away at 100 pips at the moment. However, this will swap to a trailing stop once we cross the 1.26 handle.

The image is shared below. Please let me know your thoughts.


The trend goes back to the 25th of June and has held since. Initially a resistance and now support.


Wednesday, 10 July 2019

Investment Thesis to July End

Below are some very brief summary notes from my investment thesis. Image result for Wall Street ]


My Central Forecasts: 

Fed to cut rates by 25bps at the end of July. 

This brings the Fed Funds rate down to 2.25%. Essentially removing the December hike. 

Market is priced 100% for this cut. 

Conditional upon: US CPI remaining at or below 2%. If CPI rises, then change forecast – mildly less probability of a cut. 

Q2 GDP annualised in range 2.8-3.1% - any less could indicate a 50bps cut. Any more could indicate no cut dependent upon the CPI. 

SPX500 to hit all time high by end of July 8th week. Conditional upon the above all playing out similarly. SPX500 to continue to push on until end of July – potentially adding 2%. 

Earnings seasons results to come in better than expected, but still not promising. Especially confident in my own shareholdings. 

Situation in the Gulf of Mexico and tropical storms to mean that oil prices remain in the $55-60 range. Conditional upon no major escalations in the Middle-East Which I expect to remain quiet until the end of the month at the least. 

Continuation of trade talks and announcement of another meeting – push SPX500 up another 1%. 

GBPUSD to continue downtrend. Especially after installation of Boris Johnson.

Forecast for end of July: £1 = $1.22 EURUSD to take a temporary bounce from the cut by the Fed (again assuming all of the above).

Pushing back towards $1.14 However, also depends on key German data as to whether the ECB is likely to take further action. Watch Lagarde comments for future directional impulse.

VIX – Likely to descend down to the $13 level again. At this level, may be worth purchasing some contracts as spike likely as earnings season really heats up. Heading into August/September/October I expect a significant increase in volatility. At which point Trump will make sudden progress with the China trade talks.

Friday, 5 July 2019

Why did I just lose big on non-farm payrolls?

Full disclaimer, this post comes directly from my own private trading diary and I have not moderated it in any way. I have posted it here to try and provide some level of accountability towards my new strategies. 

Ok, so the day began poorly suffering a cumulative £30 of losses on oil and gold overnight. This was the beginning of the problem as it led to anxiety about recovering losses. 

However, the main losses of the day occurred during the NFP session. First of all, I was entirely correct to short the SPX500 after the bad payrolls data. This was a perfect move. However, the lack of patience meant that I panicked when the market initially moved upwards on the back of algorithmic buying. This panic occurred because the size of the position I was using was too great; meaning that the losses were racking up relatively quickly. Thus, a 3 pip move in the SPX led me to panic and cause me to stop-out. The market subsequently fell 10 points – meaning that a £10 loss could have been a £30 gain in two minutes. 

Second of all, the gold trade was another mistake. I should have been fully prepared for NFP by closing all trades which may suddenly have been activated as a result of the sudden movements which were likely to occur. However, once again we learnt that the main issue was one of patience. My stop loss of $7 was simply not great enough to provide me the leeway necessary to move back down and correct – as it did. The market continues to be moving downwards. 

In reality, what I should have done with the gold trade was to close it immediately – it was opened by accident and the market had already plummeted 1.25% - it was unlikely for gold to move any further on the back of jobs data. 

On the whole, I have decided to stop trading myself for the day due to the losses which have been suffered and the likely effects this would have on my psyche. I fully intend to return to trading fully on Monday. 

The plan for the weekend is to do some technical analysis of the EURUSD – which I expect to continue to weaken up until the GDP numbers, GBPUSD which I plan to strengthen mildly until we reach the final vote, and the oil markets which I expect will get stronger on the back of growing tensions in the Iranian area. I was particularly surprised by the oil losses this morning as it appeared that the fundamentals – the seizing of the tanker in Gibraltar – were on my side. However, once again we saw a stop-loss which was too tight, and if we had stayed in the market then we would have achieved better results. 

Finally, I think the main reason why today went badly was due to the late start – which meant I was behind on my schedule and did not have time to fully prepare for the NFP report. 

As I finish typing, gold has fallen back below my entry – again demonstrating the losses sustained were unnecessary. 

As predicted, the SPX500 is now down 1% - I expect this trend to continue into the week ahead. 

Enjoy the weekend. 


P.S. You can find all of my trades @LukeYoungInvest on Twitter. 


:)